
Get the Most Out of BX Reports
Unlock the full value of your finance‑ready, operations‑focused Power BI reporting suite for Acumatica.
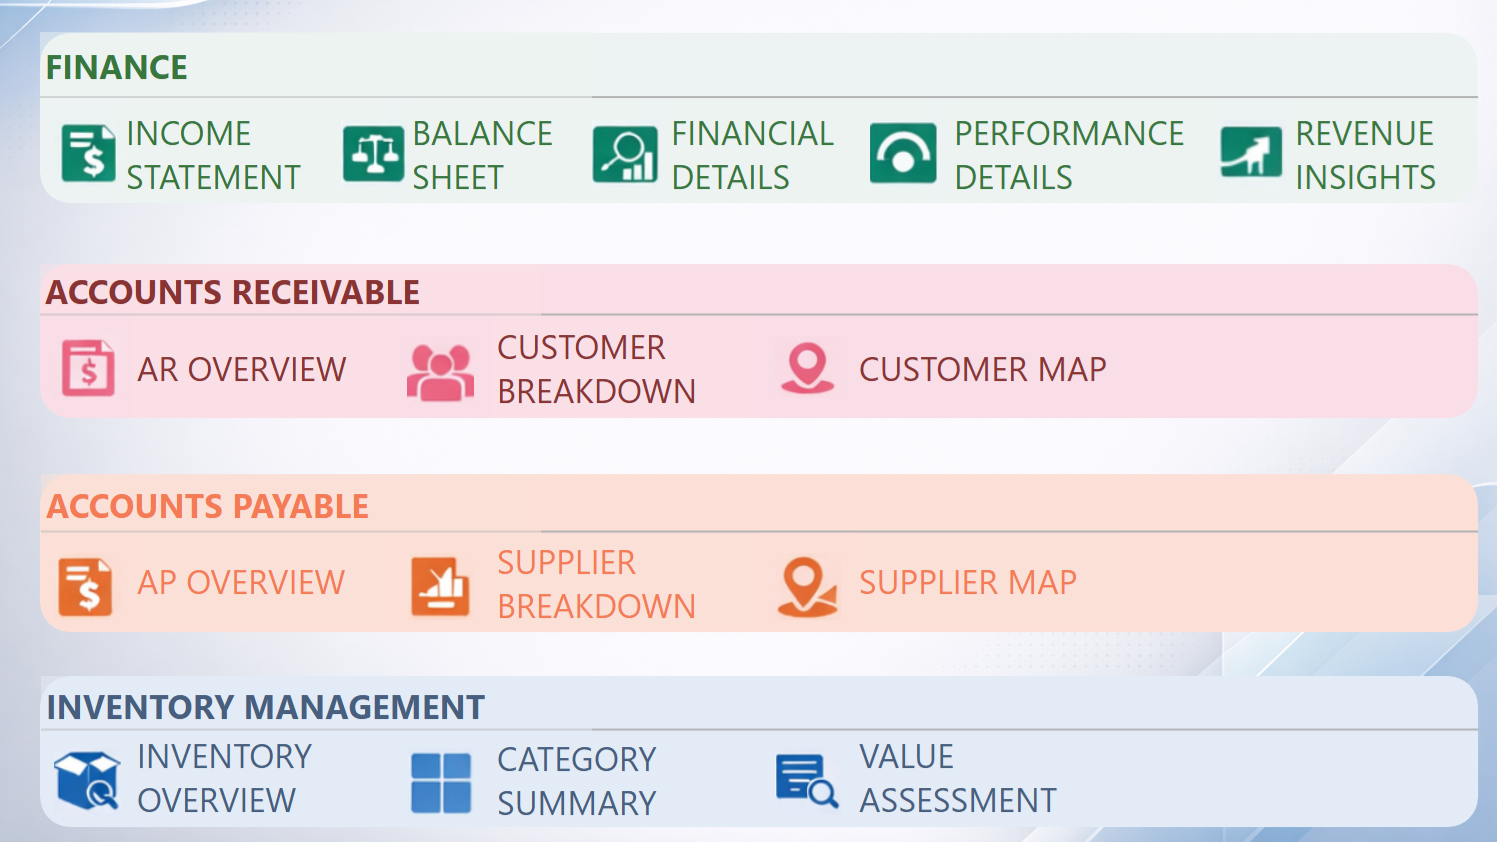
1. Start With Your Core Dashboards
BX Reports includes 14 plug‑and‑play dashboards built by Acumatica consultants with 10+ years of experience. Each one is designed to answer the questions finance and operations teams ask every day.
How to get value fast:
Explore each module (Finance, AR, AP, Inventory, Sales, Purchasing)
Identify the dashboards that matter most to your month‑end and daily operations
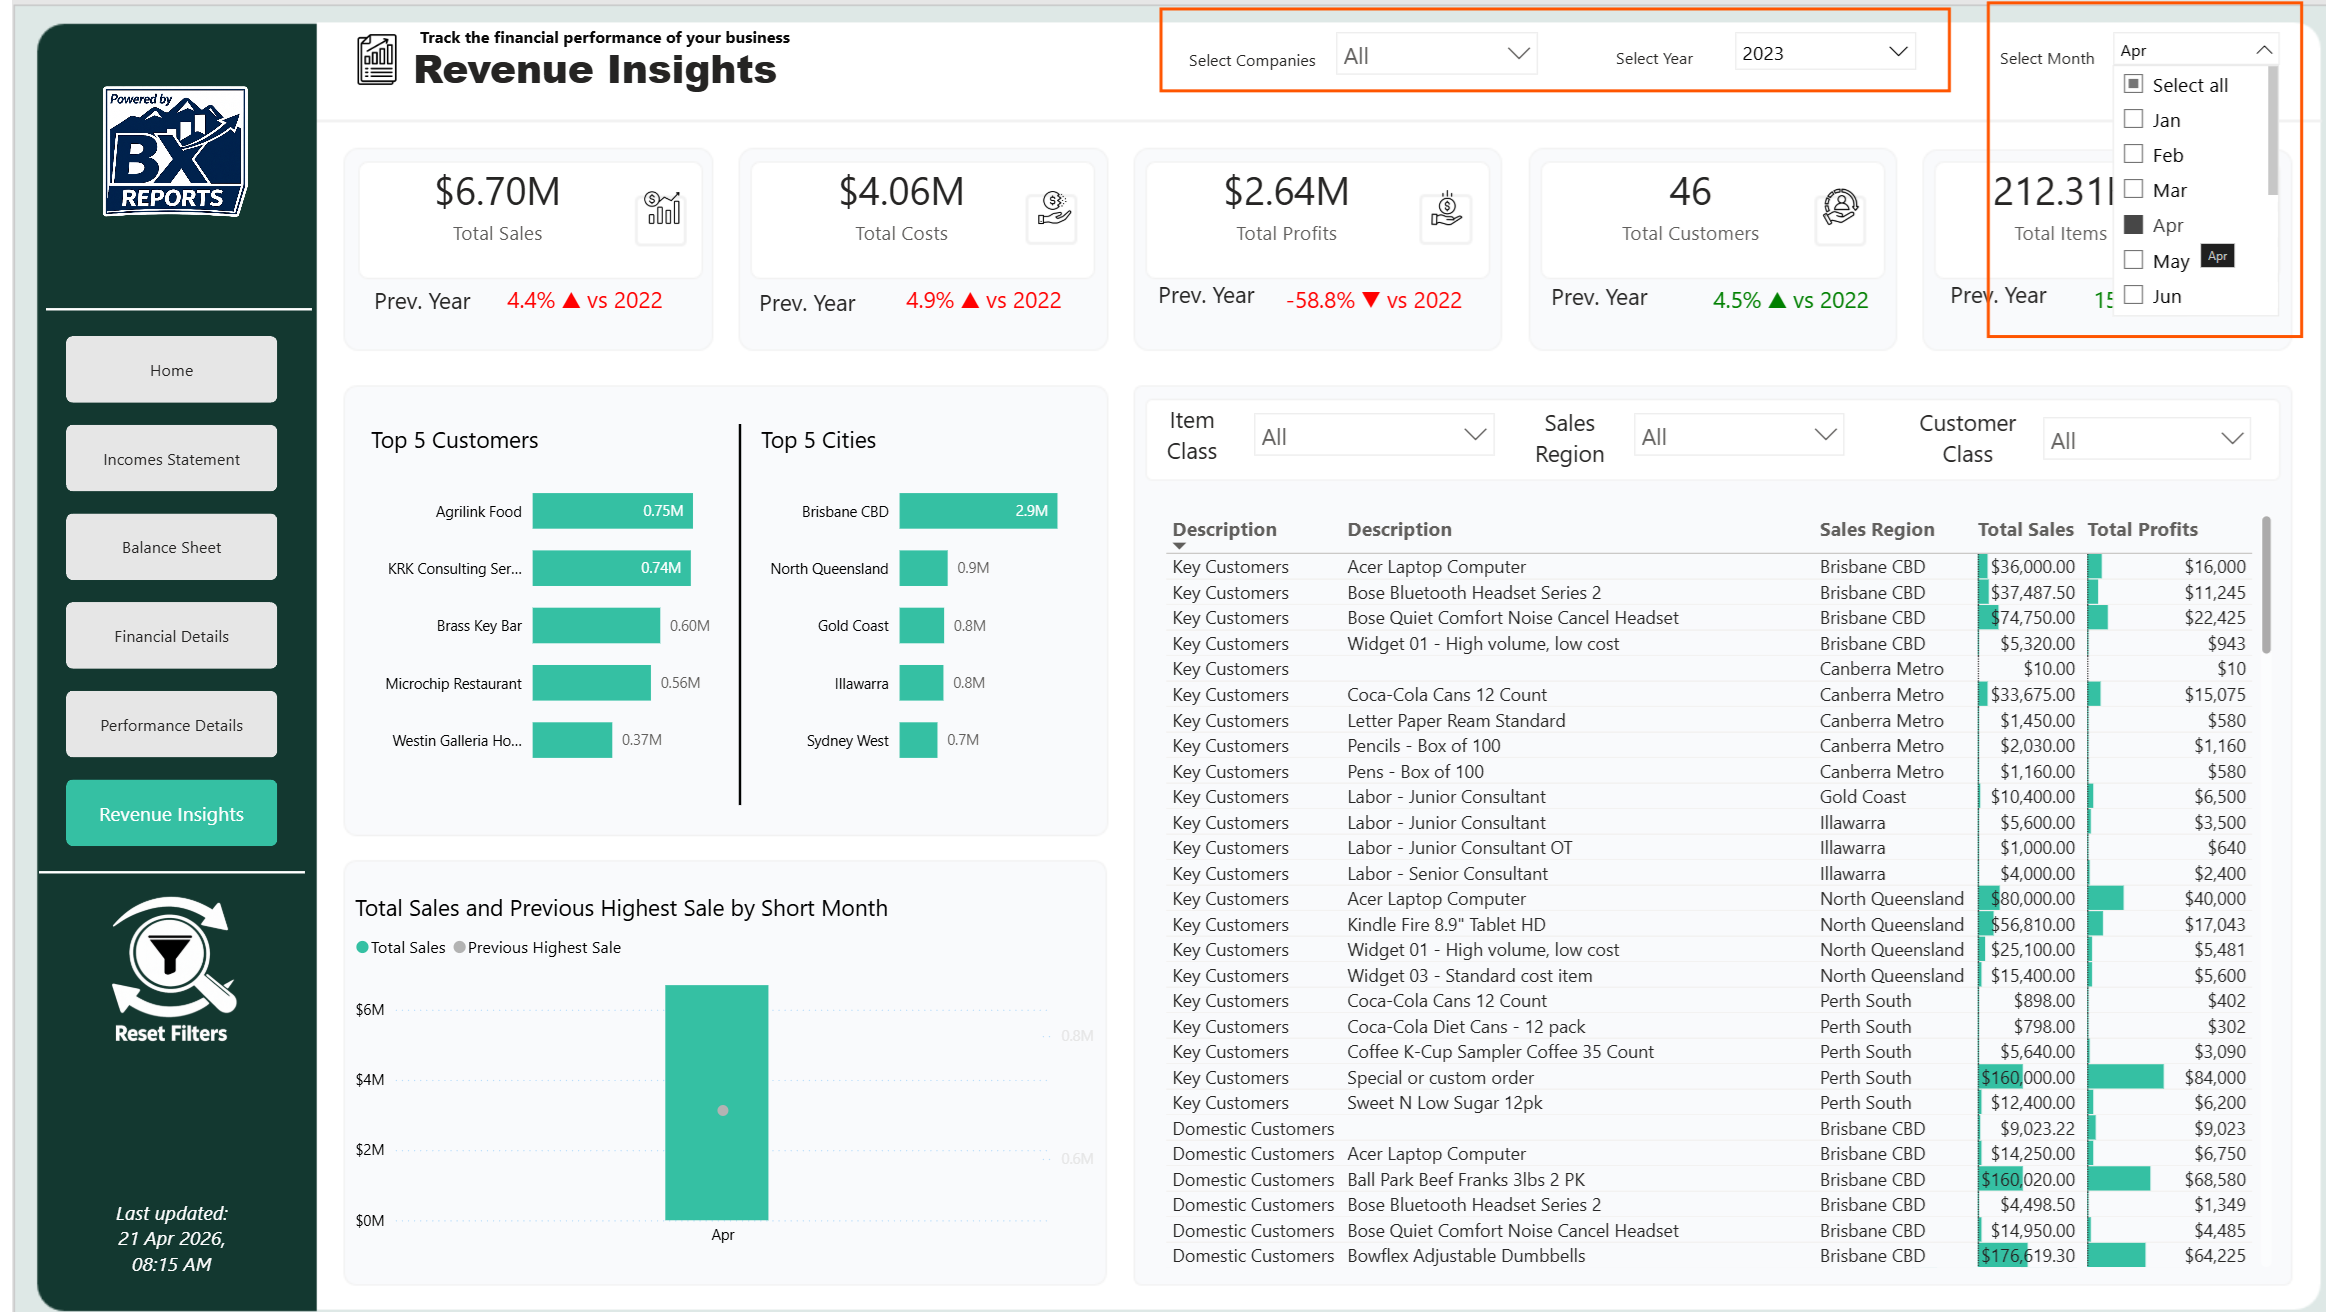
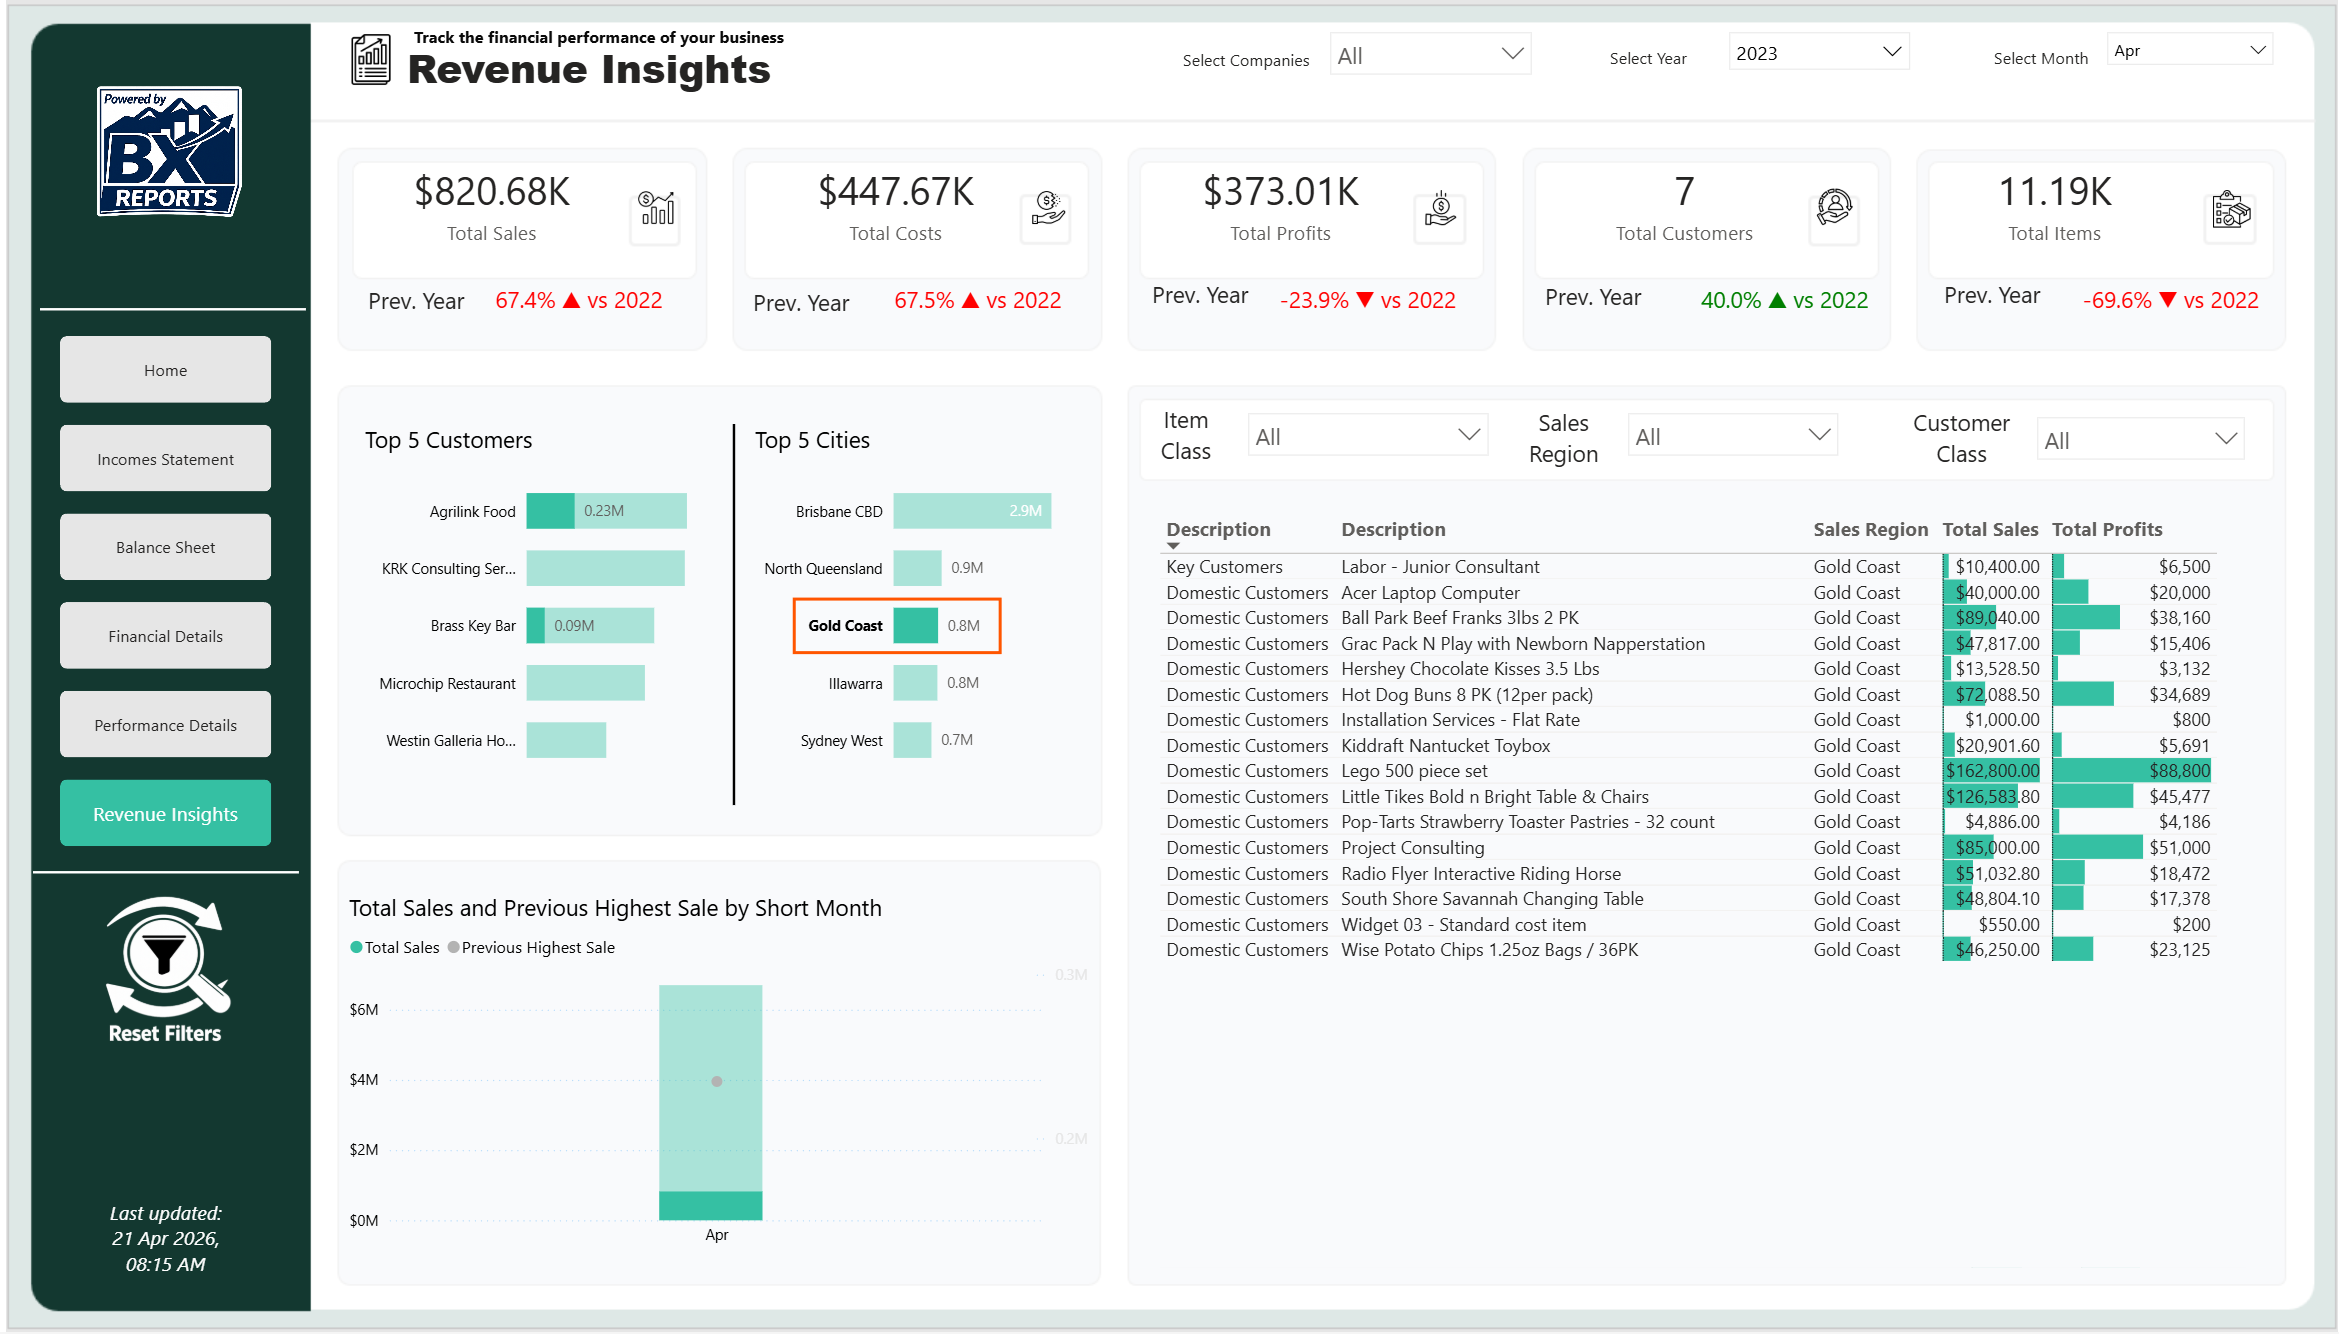
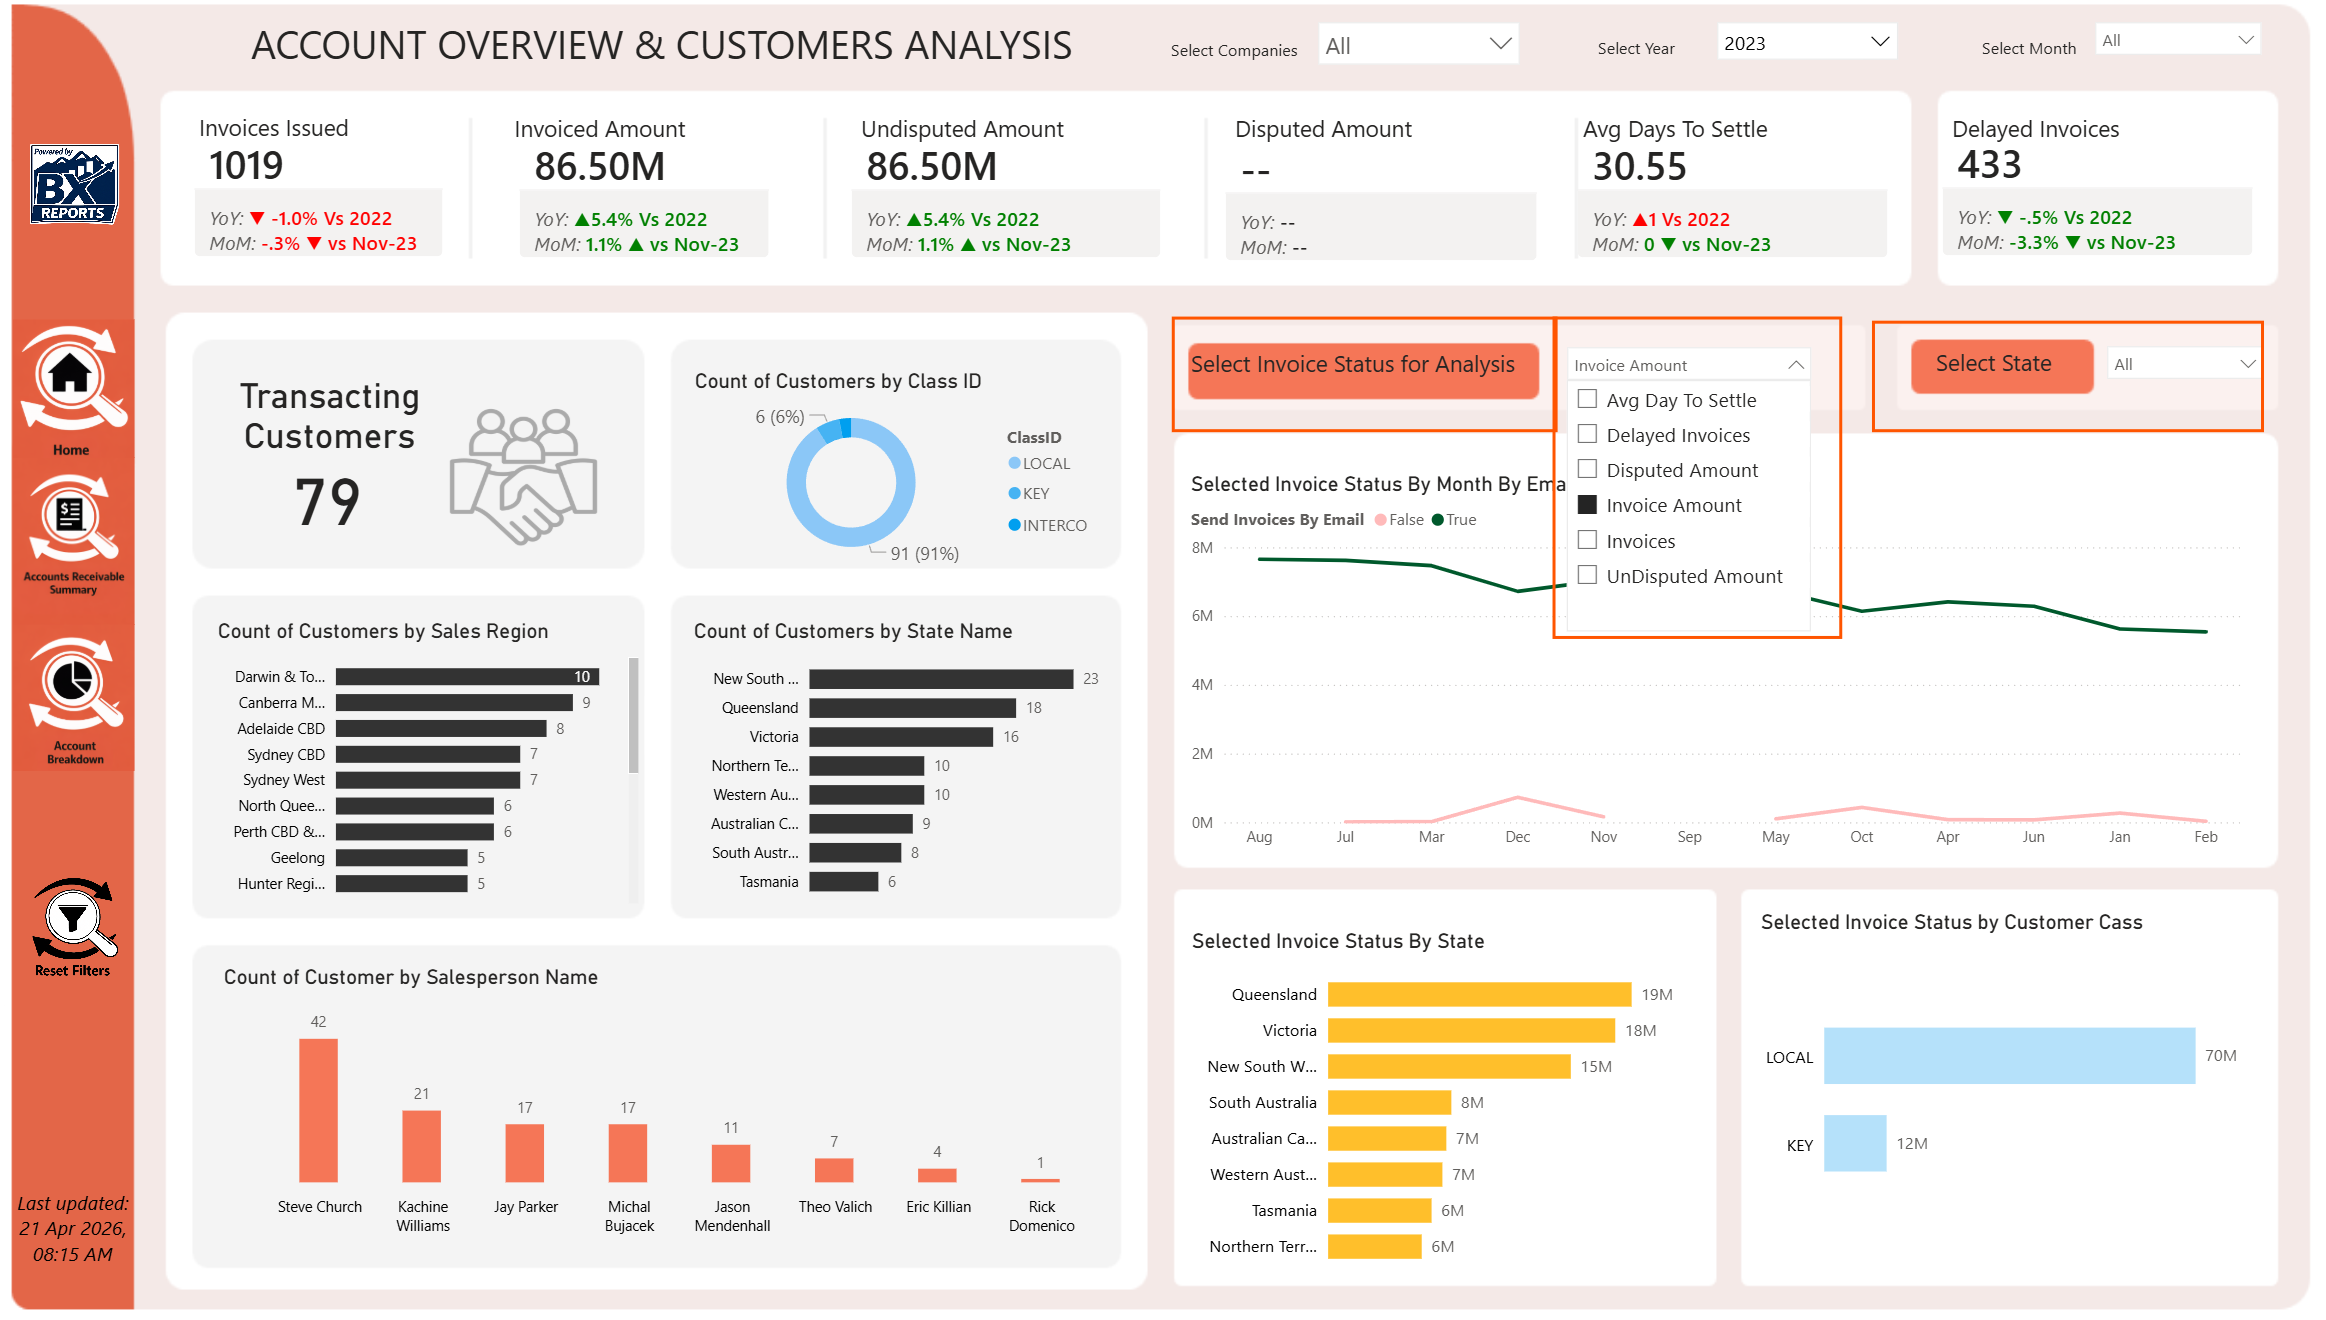
2. Use Filters to Drill Into the Detail
Every dashboard includes intuitive filters so you can slice data by period, branch, customer, item, or dimension — without exporting to Excel.
How to get value fast:
Use date filters for trend analysis
Filter by customer or item to diagnose issues
Combine filters to isolate root causes
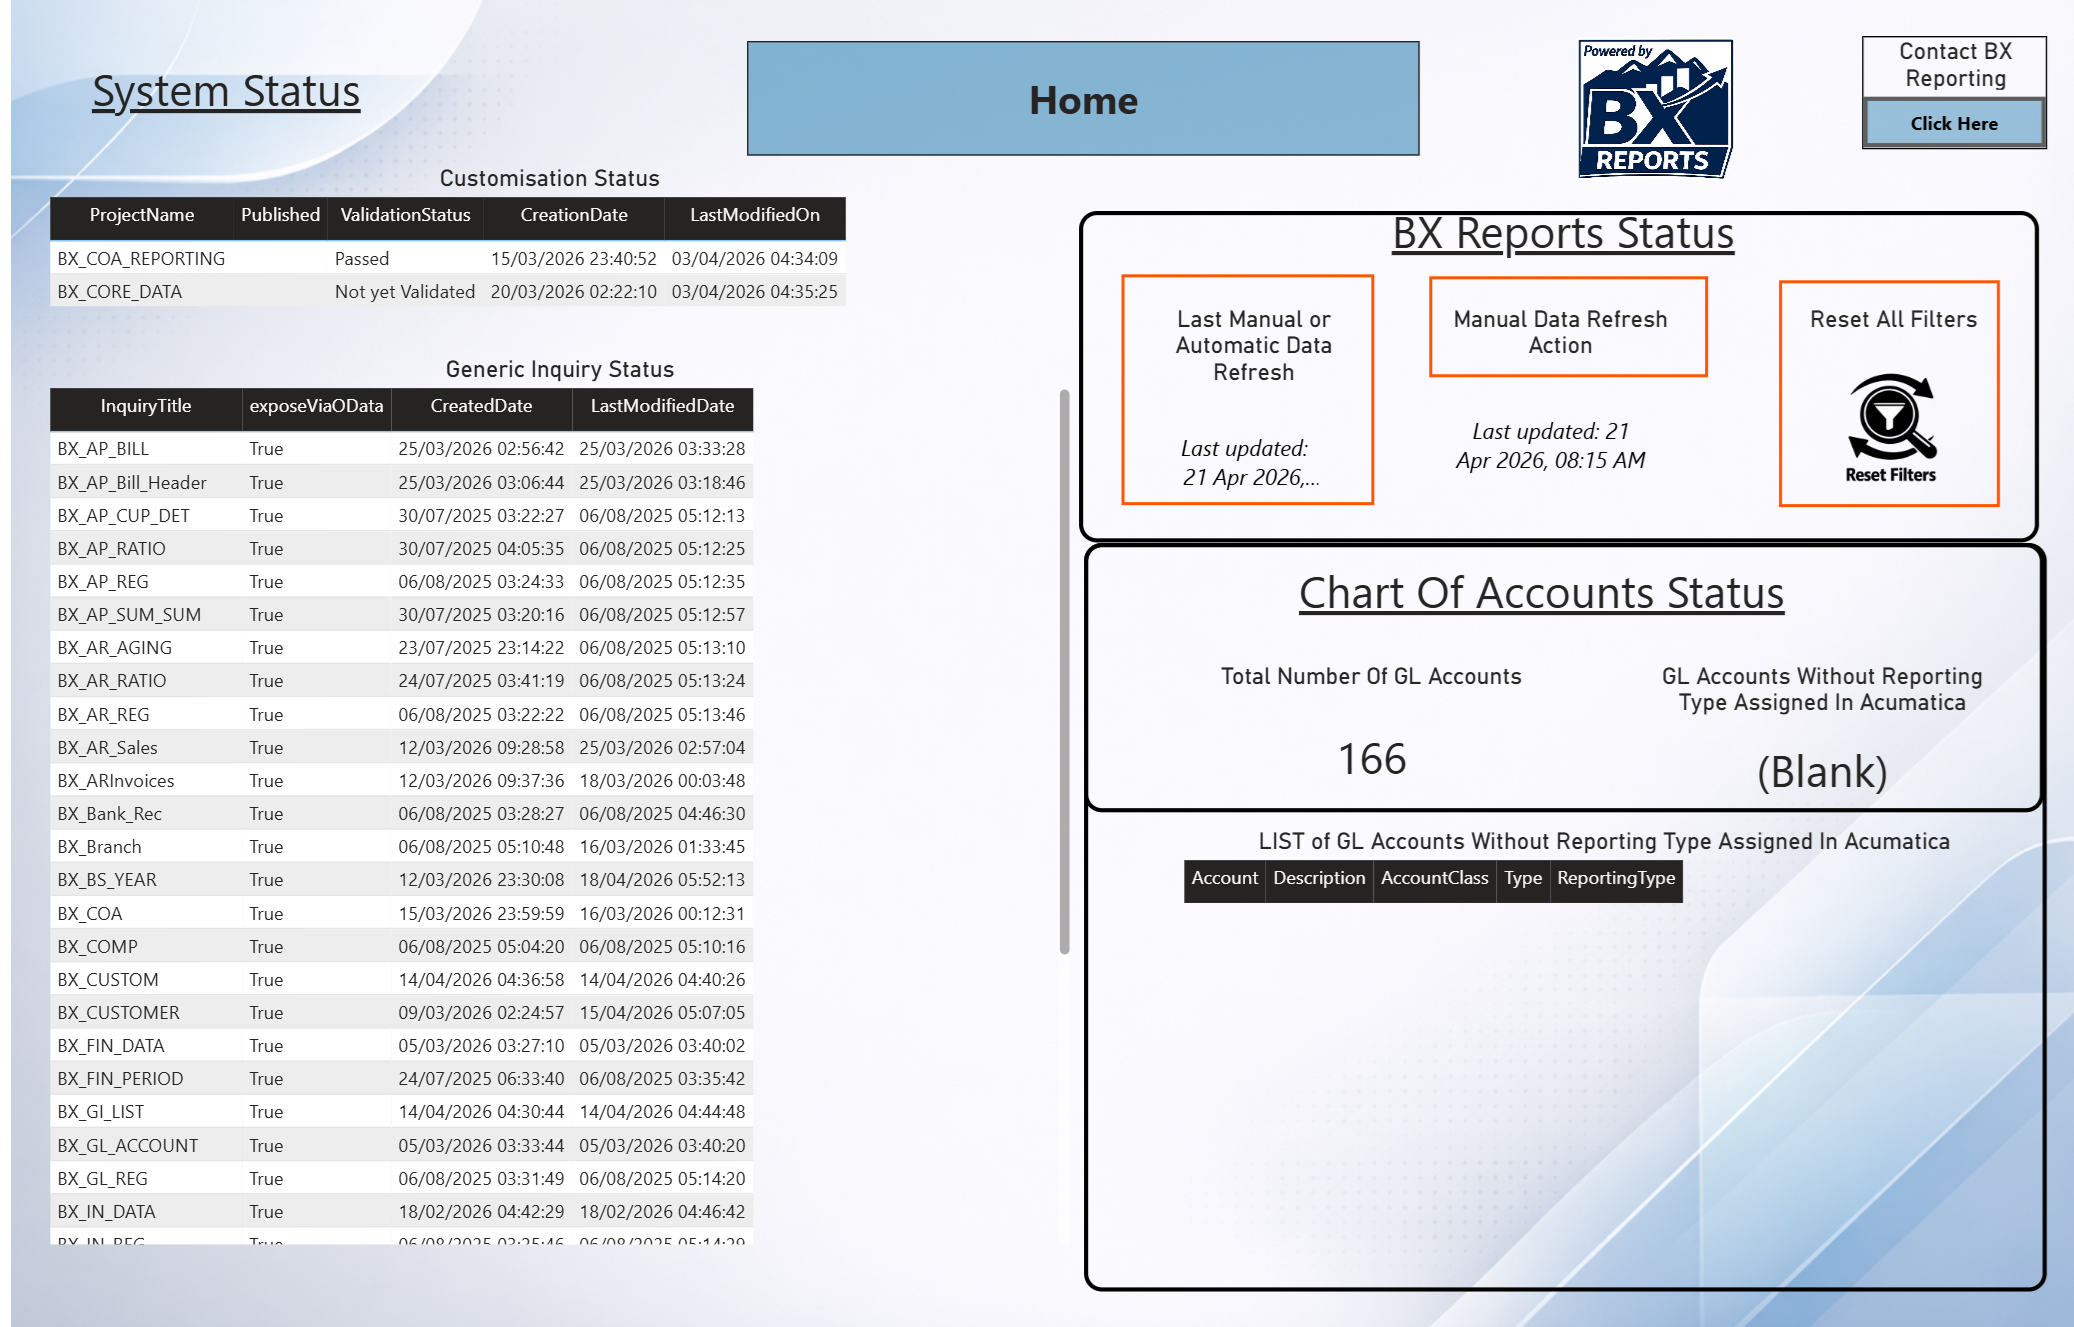
4. Refresh Your Data When You Need It
BX Reports refreshes automatically every day, but you can trigger a manual refresh anytime.
How to get value fast:
Use scheduled refresh for daily reporting
Trigger manual refresh before meetings or month‑end
Confirm refresh status in Power BI Service
5. Reach Out When You Need Help
Whether you need guidance, enhancements, or help interpreting your data, our team is here to support you.
3. Use the Built‑In KPIs to Drive Action
BX Reports includes curated KPIs for cash flow, AR aging, AP exposure, inventory velocity, and more.
How to get value fast:
Monitor KPIs weekly or daily
Identify trends early
Use KPI thresholds to guide decisions